“You’re pathetic.”
Those were the strong, harsh words my father uttered when I couldn’t find the strength to walk up the steep mountain near my grandparents’ home in Yauco, Puerto Rico – the same mountain my mother swore she climbed every day as a little girl to get to school.
I had to stop every three minutes. My father, a lifelong athlete and former marathon runner, saw my struggle as an embarrassment. In his own way, I think he meant to motivate me. Instead, he lit a fire.
I was angry. I was offended. But I was also determined to prove him wrong.
The next day, we made the same 30-minute trek to the top of the mountain. This time, I popped in my headphones – tuning out my dad’s voice – and pushed forward without stopping once. I even made the walk back down without taking a single break.
“I sure showed him,” I thought.
Looking back now, I realize that it was he who showed me.
He showed me I was capable of more than I believed. I didn’t need weeks of training. I just needed resolve – a decision to stop being lazy, to stop holding back.
In the words of Napoleon Hill, “Effort only fully releases its reward after a person refuses to quit.”
That lesson stuck with me.
I try not to measure my worth by what I can do right now. I focus on what’s possible – on the good I can do if I commit fully. That mindset has shaped how I live, how I work, and how I invest.
It’s also how I approach this column.
The Value Meter was never meant to be a finished product. It’s evolved over time, becoming more objective, more robust, and more useful to everyday investors.
Today, I’m proud to officially introduce version 3.0 of The Value Meter.
At its core, the mission is the same: to help you quickly gauge whether a stock is undervalued, overvalued, or fairly priced based on real business fundamentals.
But this latest version includes three important upgrades:
➢ We now analyze up to 12 quarters of free cash flow instead of just four. This gives us a clearer picture of a company’s long-term strength, not just recent performance.
➢ We measure how consistently free cash flow is growing over time, quarter by quarter. This means we can better identify companies that are on the rise – not just those that are already efficient.
➢ We filter out extreme outliers that used to skew the rankings. That way, companies are judged by fundamentals, not flukes.
These changes make the system smarter and sharper, but it will still be grounded in the same common-sense approach that’s made value investing so powerful for generations. (It’s also shifting from a six-point scale to a 10-point scale, with 0 being the most undervalued and 10 being the most overvalued.)
Let’s take the upgraded Value Meter for a spin.
Today’s featured company is one that embodies long-term discipline and durable strategy.
Deere & Company (NYSE: DE) is the world’s leading manufacturer of agricultural and construction equipment. From John Deere’s first steel plow, forged in 1837, to today’s precision agriculture technology, this Illinois-based giant has consistently evolved to meet changing needs.
The financial picture tells a story of resilience during challenging times.
In the second quarter, net sales dropped 16% to $12.8 billion year over year. Net income fell 24% to $1.8 billion, or $6.64 per diluted share. Large agricultural equipment demand declined roughly 30% in the U.S. and Canada.
Despite these headwinds, Deere maintained an 18.8% operating margin for equipment operations. The company produced $568 million in operating cash flow during the first six months of fiscal 2025 even as revenue fell 22%.
Deere faces additional pressure from tariffs, as it expects over $500 million in pretax impact for fiscal 2025. However, the company holds nearly $8 billion in cash and equivalents, which provides substantial financial flexibility and helps fund its 1.3% dividend yield.
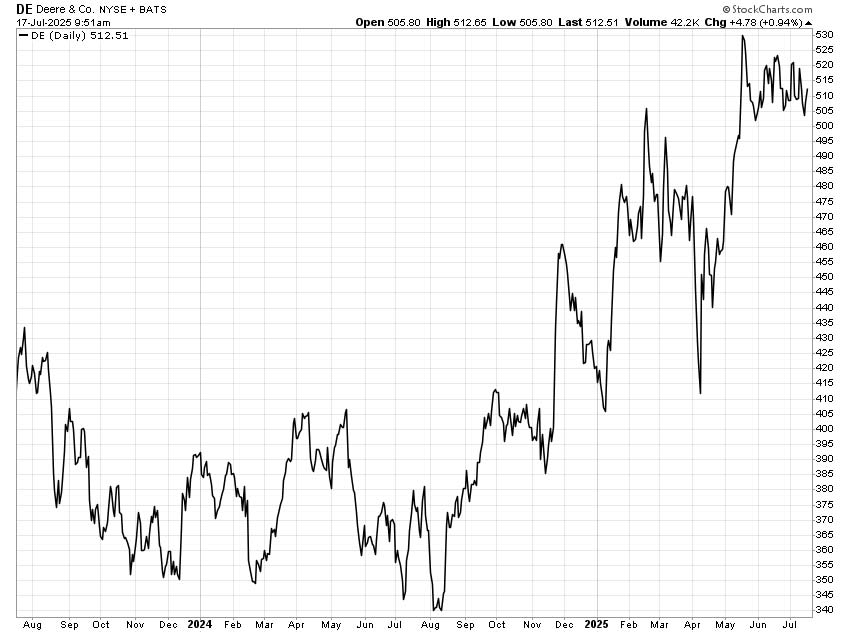
The stock has reflected these mixed signals. After peaking near $430 in mid-2023, shares tumbled to around $340 over the next year before rising to current levels around $500.
Let’s see what the new and improved Value Meter tells us about Deere’s true worth.
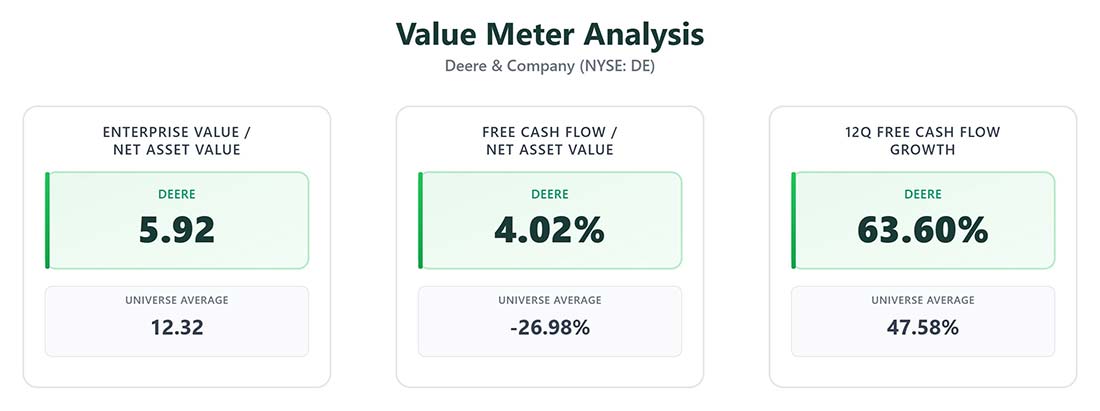
The company’s enterprise value-to-net asset value ratio (EV/NAV) of 5.92 means you’re paying roughly $6 for every dollar of business assets left over after covering the liabilities. With the average EV/NAV sitting at 12.32, Deere is trading at less than half the typical premium.
Deere excels in cash-efficiency, with a free cash flow-to-net asset value (FCF/NAV) of 4.02%. This means the company generates over $4 in free cash flow for every $100 in net assets. Compare that with the broad market average of -26.98%, and you’re looking at a rare cash-generating machine.
Over the past three years, Deere’s free cash flow has grown quarter over quarter nearly 64% of the time, compared with the 47.58% average.
This isn’t a company that’s coasting on past success. Deere is using this downturn to strengthen its competitive position. It is investing $20 billion over the next decade in U.S. manufacturing and technology development. That will help it continue to create innovations like its See & Spray precision technology, which covered 1 million acres in 2024 and already has 1,000 new orders this year.
Digital engagement metrics tell the story. Engaged acres (the number of acres that are accounted for in the company’s online farm management system) grew 15% to 475 million, creating sticky, high-margin software revenue that compounds over time.
Of course, it won’t be smooth sailing ahead. Agricultural cycles can last years, and tariff uncertainty adds complexity.
But for patient investors, temporary problems often create the best opportunities.
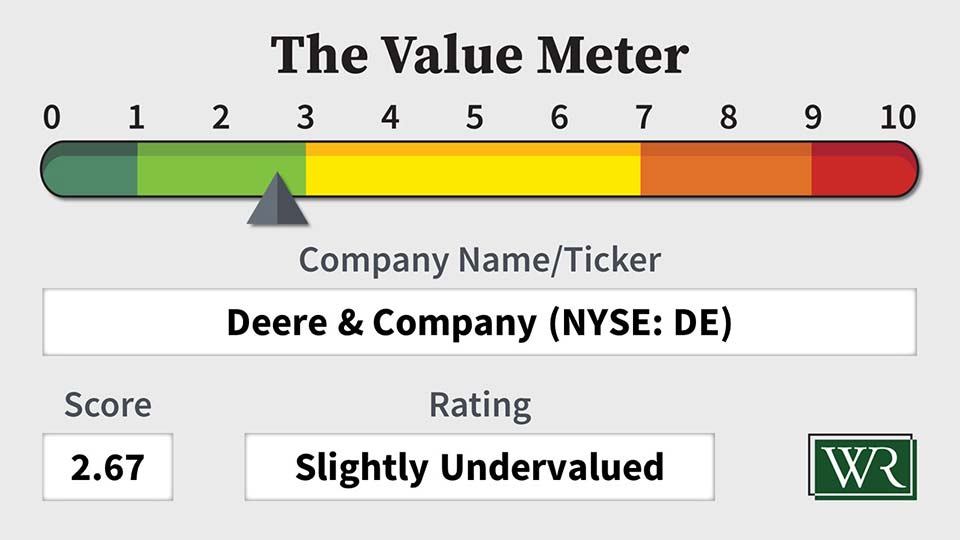
The Value Meter rates Deere & Company as “Slightly Undervalued.”
What stock would you like me to run through The Value Meter next? Post the ticker symbol(s) in the comments section below.