Early in my career, I had a lightbulb moment when everything became clear to me.
I was just starting my job as a sell-side analyst. I was building financial models in Microsoft Excel, changing one variable to see how it would affect the others.
As I was playing with the spreadsheet and changing all of the things that don’t really affect the business, like depreciation and shares outstanding, I saw how much earnings were affected.
It was pretty profound. That showed me there were ways that a CEO could easily manipulate earnings and tell the story that they wanted to tell. Yet you couldn’t do the same with other metrics.
Earnings are nice, but they don’t always tell the story of how the business is actually performing.
Think about it in relation to your own finances. Your taxable income may be affected by things like mortgage interest, mileage driven to a job, professional dues, and subscriptions. You factor all of those things in and then report to the government what your taxable income is.
But that doesn’t accurately represent how much money you brought in during the year. Mileage is not a direct cost. Perhaps your brother-in-law finally paid you back the $1,000 you loaned him. Those things affect the actual amount of money you have available, which is a much more meaningful number when you’re trying to set a budget or figure out how much to save or invest.
This concept has big investing implications.
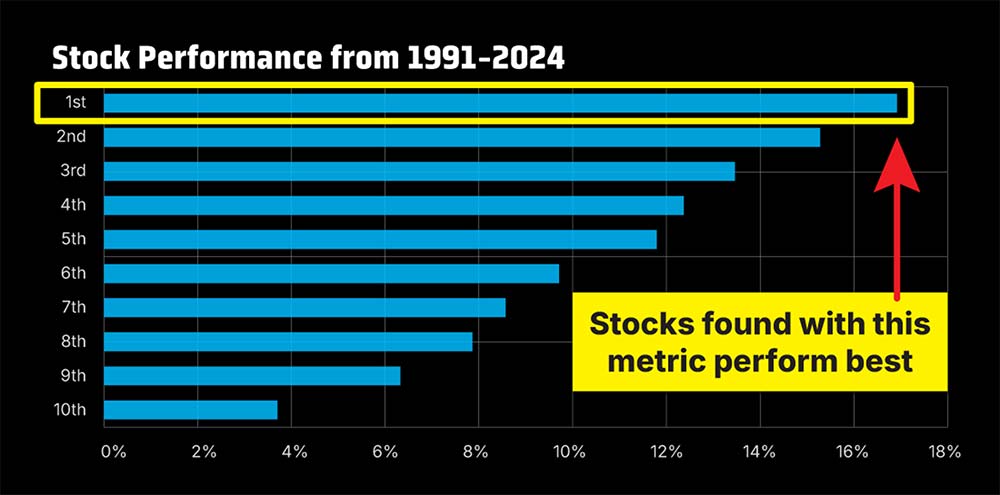
Pacer ETFs conducted a study of the largest 1,000 stocks in the market as measured by the Russell 1000 over the past 34 years. I won’t go into all the details of their calculations, but in short, they used a metric that shows how much cash a company generates, adjusted for its market cap and debt.
The study found that companies that ranked in the top 10% in this metric generated the highest returns. In fact, the stocks’ performance matched the companies’ ranks exactly.
Tech darling Broadcom (Nasdaq: AVGO) is a great example of the pitfalls of blindly following earnings. Ten years ago, not many people were paying attention to this chipmaker. Profits swung to a net loss of $1.7 billion in 2016 and continued to bounce around over the next several years.
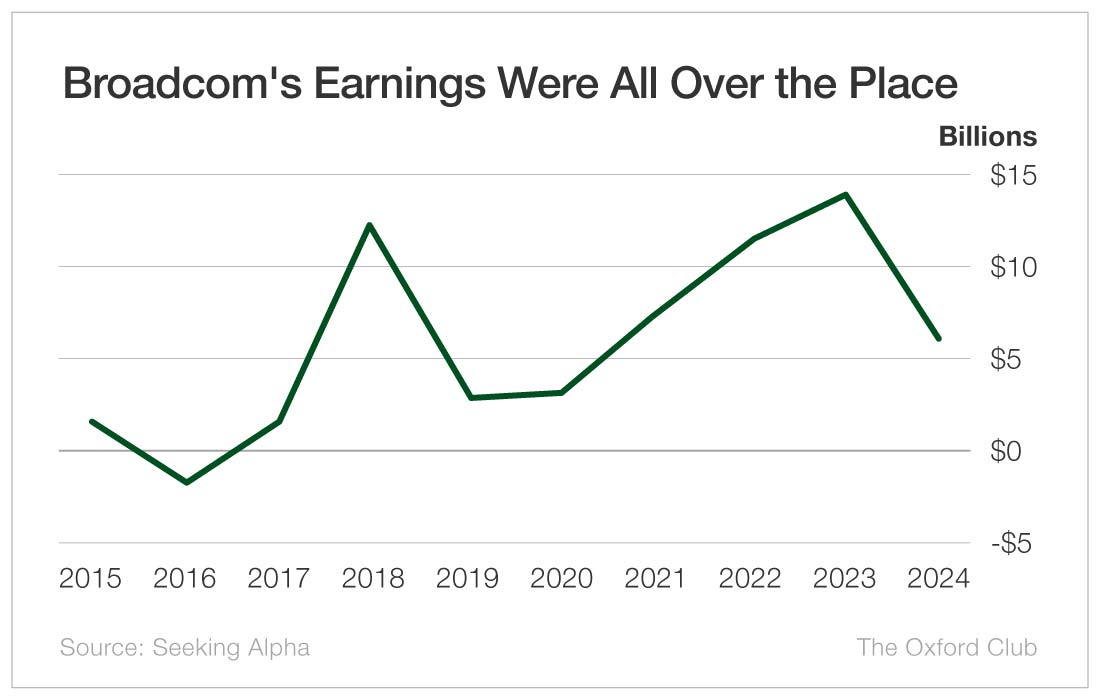
If you were only focused on earnings, you might have bailed in 2016 when earnings went negative… or in 2019, when they fell by 78%… or last year, when they dropped by 58%.
You would have missed out. Bigly.
Over the last 10 years, an investment in the S&P 500 would have more than tripled. Over that span, $10,000 would’ve turned into $34,549 with dividends reinvested.
A $10,000 starting stake in Broadcom would have turned into $339,986 with dividends reinvested. The price appreciation alone would have been worth $195,727.
Don’t get me wrong – I like earnings. I also like ice cream. But both are not that important to me. There are other indicators that tell me whether a company is worth investing in. If certain metrics aren’t trending in a positive direction, I’m not interested, regardless of what earnings are doing.
In some cases, I actually like when earnings are negative, because chances are most investors have passed over the stock.
Be sure to add some more indicators into your toolbox other than earnings. It will greatly improve your investing performance.